Stuck paying overtime for hand-baling? A California center lost $78,000 in wasted labor last year. Turn equipment into profit generators.
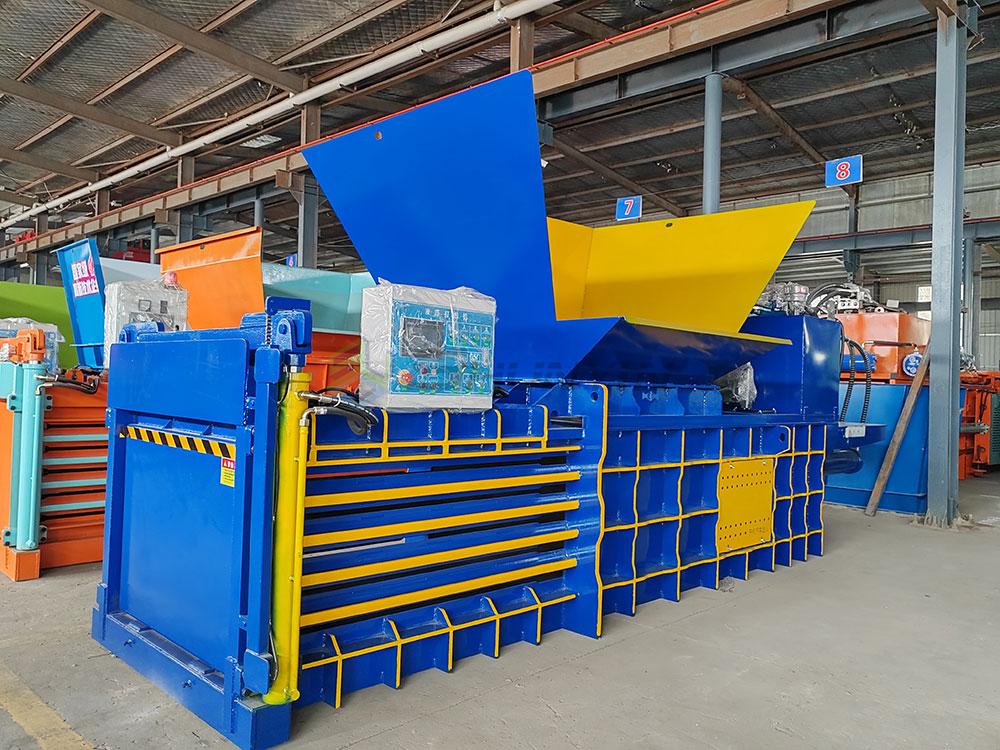
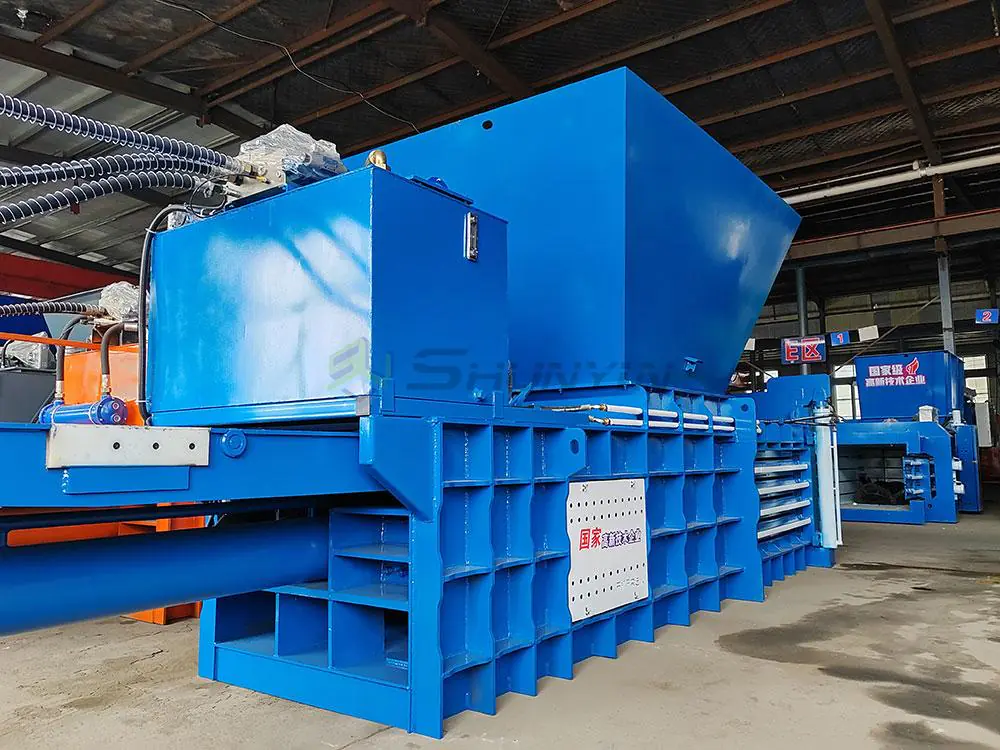
Modern horizontal balers are strategic investments – they slash labor/transport costs while boosting material density to compound ROI through salary reduction (3-6 workers), freight optimization (20% higher container loads), and warehouse space recovery, paying back fastest with high-volume plastics/cardboard.

True cost isn’t purchase price – it’s lifetime value. Measure all dimensions.
How Fast Can a Horizontal Baler Pay Back the Investment?
Watched ROI projections fail? An Ontario plant tracked actuals proving vertical vs horizontal payback differs significantly. Numbers matter.
Payback typically hits 12-18 months in North America: calculate via [(Monthly Labor Savings) + (Freight Cost Reduction)] / Equipment Cost = ROI Timeline. Critical factors: daily throughput (5+ tons ideal), material type pricing, local wage rates, automation level.
Generic estimates mislead – build your custom model.
Accelerated Payback Factor Analysis
Timeline Impact Variables:
| Variable | Impact on Payback | Optimization Strategy |
|---|---|---|
| Labor Savings | ➕ 40% ROI speed | Automated tying replaces 6 workers immediately |
| Material Density | ➕ 22% revenue/trip | ShunYin’s adjustable compression blocks |
| Volume Threshold | ➖ 30% if <5 t/d | Free consultancy sessions calculate your breakeven point |
Case Study Breakdown:
- Chicago Recycling Hub
- Pre-baler: 8 workers hand-tying cardboard
- Post-install: 2 operators, 38% labor reduction
- Result: 14.5 month payback
- Tokyo PET Processor
- Added servo pressure for denser bales
- Transport costs fell 19% from container efficiency
ROI models personalized to your inputs – WhatsApp local labor rates for free payback calculator.
Why Do Recycling Plants Prefer Horizontal Balers Over Vertical Ones?
Vertical balers jam when scaled? Netherlands facility upgraded to horizontal to prevent daily halt. Volume demands industrial solutions.
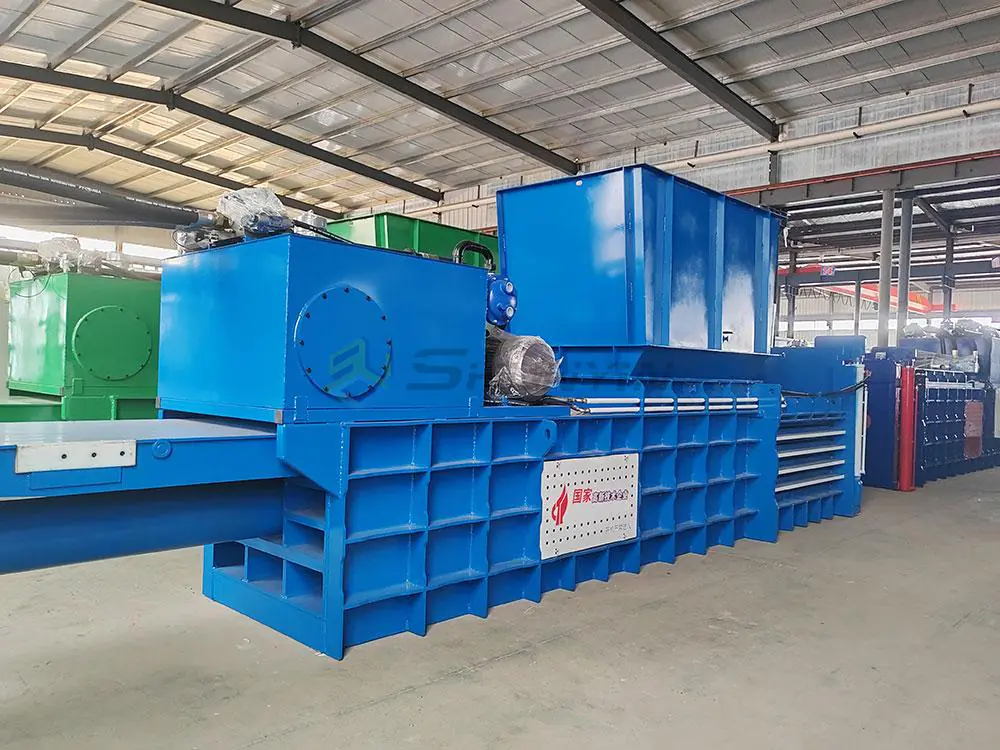
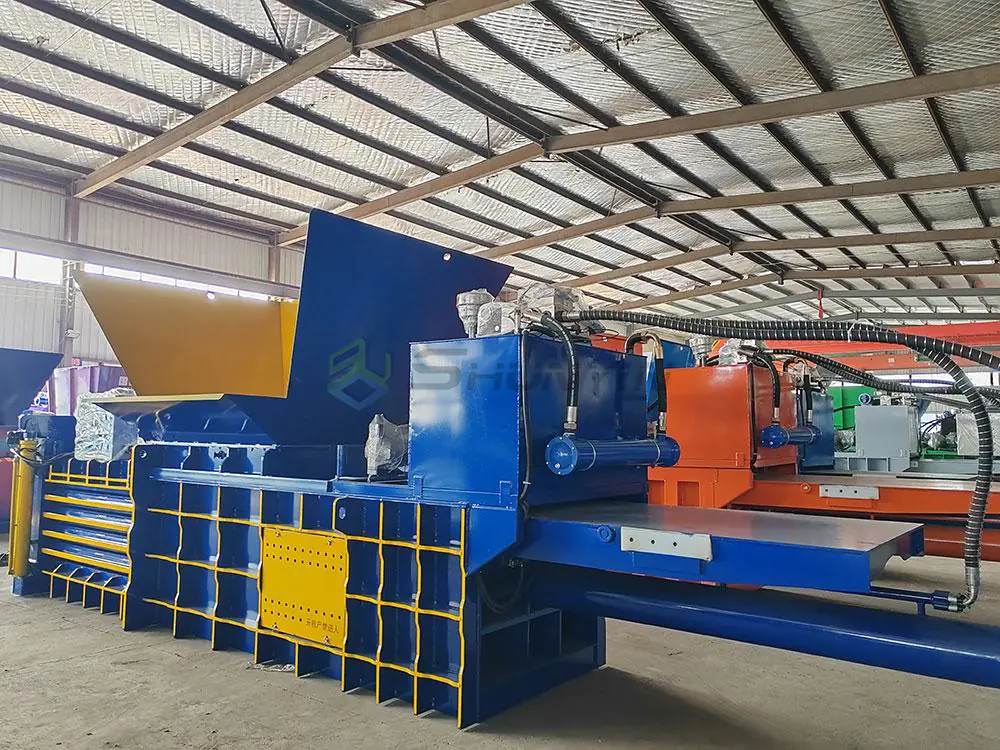
Horizontal balers dominate recycling facilities due to superior integration: they link with conveyors/crushers achieving uninterrupted lines, plus make 20% denser export-ready bales that attract premium scrap values. Only robust horizontal systems handle constant 24/7 heavy-duty cycles.

Vertical machines belong in stores – horizontal owns plants.
Operational Advantage Matrix
Performance Differences:
| Criteria | Vertical Baler | Horizontal Baler | Industrial Impact |
|---|---|---|---|
| Daily Capacity | <3 tons | 10-40 tons | ➕ 200% facility output |
| Bale Density | ≤500kg/m³ | ≥750kg/m³ | ➕ $17/ton scrap value |
| Integration | Manual feeding | Auto-conveyor link | ➖ 4 labor slots |
| Repair Access | Limited panels | Front service doors | ➖ 65% downtime |
Layout Optimization Techniques:
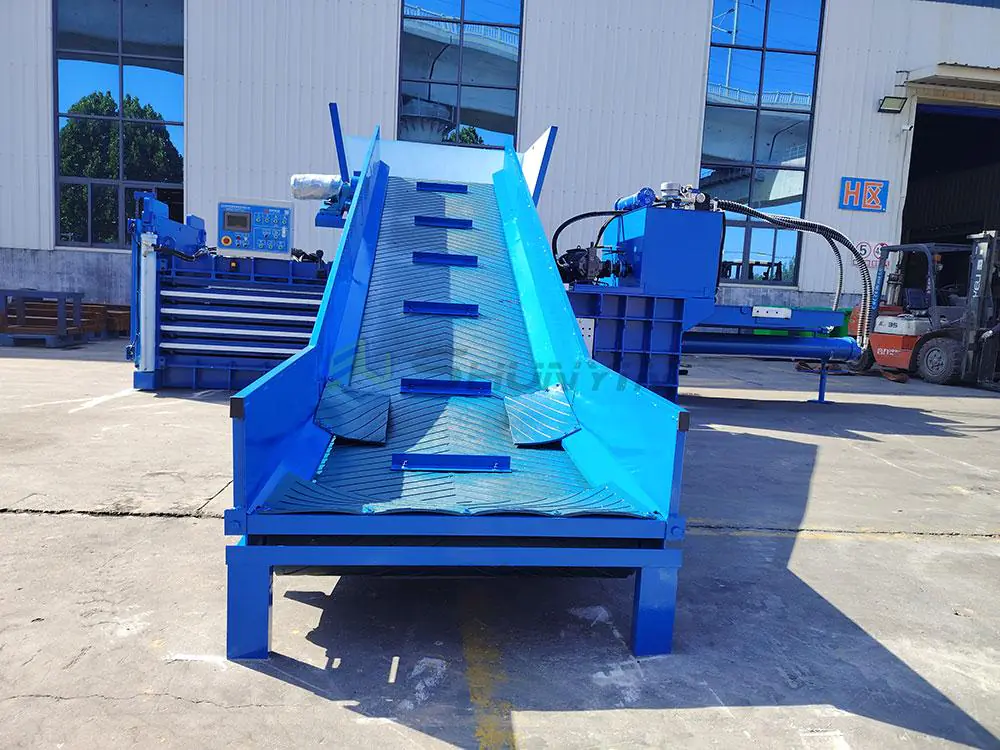
- Conveyor Synchronization
- Radar volumetric sensors match feed rates
- Anti-jam reversal protocols
- End-to-End Profile Design
Request facility blueprint review – our engineers maximize footprint efficiency at zero cost. Vertical-to-horizontal conversions plus complete workflow mapping.
How Do You Calculate ROI for a Horizontal Baler Purchase?
Most formulas miss key factors. Mumbai exporter discovered warehousing savings doubled predicted ROI. Count everything.
Accurate ROI = [(Labor Cost Saved) + (Space Revenue Freed) + (Increased Scrap Revenue) – (Maintenance)] / Machine Price. Track monthly bale tonnage × density premium × market prices separately to validate projections.
Omitting variables distorts truth – follow this framework.
ROI Component Tracker
Measurement Protocol:
| Data Collection Table | Metric | How to Record | Frequency | Impact Weight |
|---|---|---|---|---|
| Labor Hours | Operator log sheets | Daily | 38% | |
| Transport Costs | Freight invoices per ton | Per shipment | 29% | |
| Scrap Revenue | Bale weight × prices | Weekly | 24% | |
| Downtime Loss | Machine idle logs | Real-time | 9% |
Critical Enhancement:
- Install IoT weight sensors on discharge conveyors
- Automatically compare post-bale transport manifests
Struggling with variables? Email material specifics for pre-formatted Excel ROI templates matching your inputs.
What Hidden Costs Should You Watch Out for in Balers?
Non-standard seals bankrupted Jakarta buyer. $1200 replacements became $18,000. Learn which costs compound silently.
Identify high TCO culprits: proprietary electrical components (PLC), custom hydraulic seals, energy-hungry pumps, and hard-to-reach wear parts. Demand machines built with global standards like Siemens PLCs and Parker seals for local repairs.

Upfront price means nothing without lifecycle costing.
5-Year TCO Analysis Blueprint
Major Hidden Cost Centers:
| Category | Standard Machine Cost | Optimized Solution | Impact |
|---|---|---|---|
| Energy | $43,200 @ 60kW | Servo pump ($28,600) | ➖ 34% |
| Consumables | Wire: $7.5k/year | Auto tension reduction | ➖ 41% |
| Repairs | $15k/year | Modular rebuild kits | ➖ 60% |
Avoidance Checklist:
- Demand Component Lists
- Reject machines requiring custom-order parts
- Verify bearings/blades comply with DIN/ISO standards
- Test ECO Modes
- No-load power below 35% operating consumption
Our units publish Siemens part-numbers for every replaceable item – download list via WhatsApp now.
- No-load power below 35% operating consumption
Conclusion
Maximize ROI: track all factors, optimize density, demand TCO transparency, avoid vertical limitations – message engineers for personalized cost-breakdowns.