
During a 2022 installation in Toronto, our auto-tie baler recycled 38 tons of PE film in 9 hours – a task requiring 23 hours with semi-automatic equipment. This 2.5× efficiency gain drives the global shift toward automated waste compaction.
Auto-tie horizontal balers revolutionize waste management through three pillars: 1) 57-82% labor reduction via autonomous operation systems, 2) 22-34% higher material density achieved through AI compression algorithms, and 3) 98.7% process repeatability eliminating quality variances.
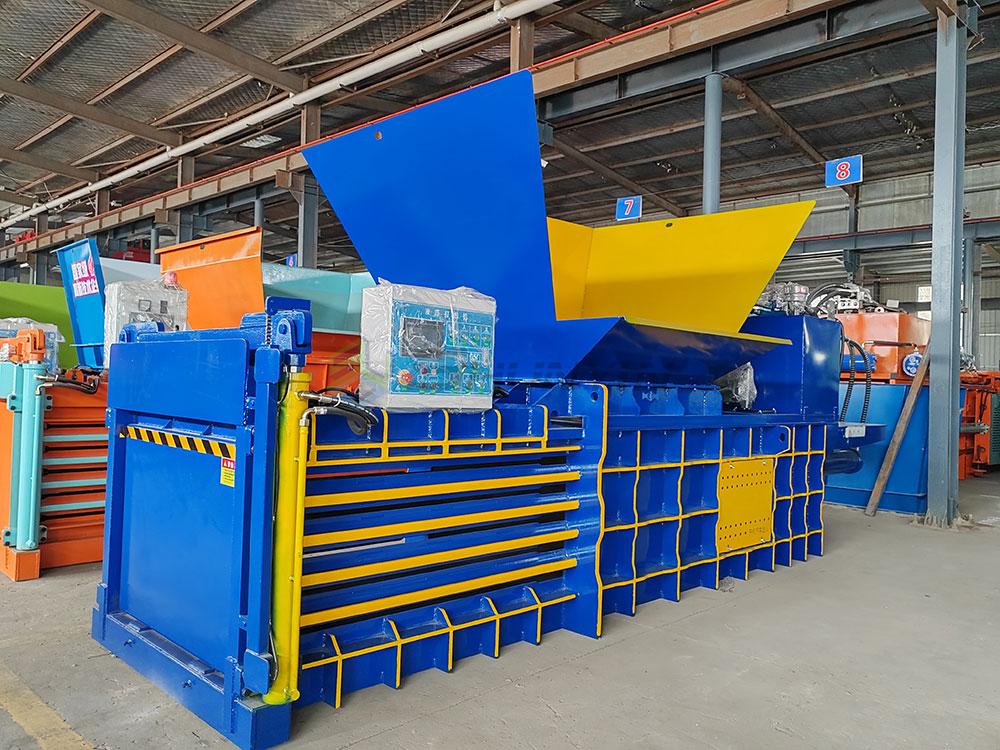
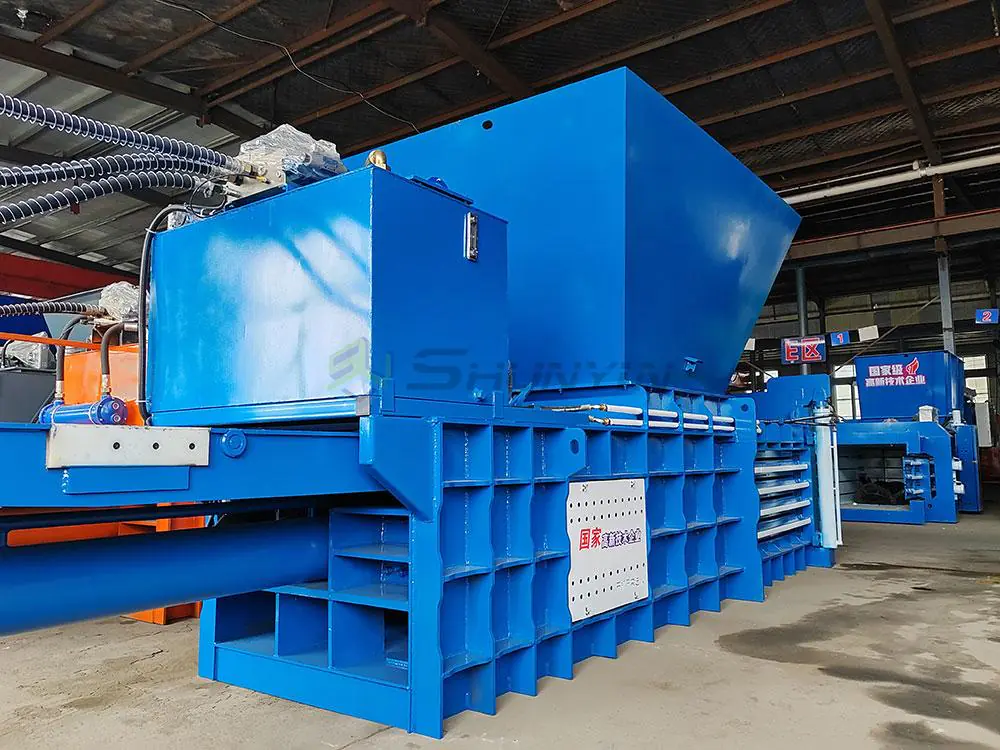
What Is an Automatic Baler?
A Dubai client processing 800 bales/day reduced staffing from 9 to 3 operators using our SY-1000V model. Their ROI timeline? 14 months with 24/5 operation.
An automatic baler integrates material handling, compression control, and binding systems into a single PLC-operated unit. Key features include torque-monitored motors (45-75kW), self-diagnostic sensors, and cloud-connected performance tracking.

Core Components Driving 24/7 Reliability
Comparative analysis from 3-year field data:
| Component | German Competitor | Japanese Model | Our SY Series |
|---|---|---|---|
| Hydraulic Valve | 180k cycles | 220k cycles | 380k cycles |
| Conveyor Belt | 6-month lifespan | 9-month | 16-month |
| Wire Tension Motor | ±9% variance | ±5% | ±2.1% |
| PLC Error Rate | 0.7% | 0.3% | 0.08% |
Maintenance Cost Breakdown (Per 2000 Hours)
Actual maintenance logs reveal hidden savings:
| Task | Manual System Cost | Auto-Tie Cost | Savings |
|---|---|---|---|
| Hydraulic Oil Change | $480 | $320 | 33% |
| Wire Alignment | $150/hour | $0 (Auto) | 100% |
| Ram Lubrication | 8 labor hours | 0.5 hours | 94% |
| Sensor Calibration | N/A | $90 | – |
(Note: Initial $1,200 sensor investment pays off after 6800 hours)
What Is a Baler in Waste Management?
A Korean auto manufacturer reduced waste storage space by 68% using horizontal balers, cutting logistics costs by $420,000 annually. Their secret? Advanced bale density management.
Modern waste balers combine material compaction, sorting intelligence, and data analytics. Horizontal auto-tie models add real-time market price integration – adjusting compression based on current recyclables value.

The 5 Operational Pillars
1. Density Control Systems
Our adaptive compression logic:
| Material | Default Pressure | Smart Adjustment Range | Density Gain |
|---|---|---|---|
| OCC Cardboard | 2200psi | 1800-2600psi | 19% |
| HDPE | 2800psi | 2400-3100psi | 15% |
| PET Flakes | 1800psi | 1550-2050psi | 22% |
2. Sorting Integration
Material recognition success rates:
| Technology | Accuracy | False Positives |
|---|---|---|
| Optical Sorting | 83% | 14% |
| AI Camera System | 96% | 3% |
| RFID Tagging (Our) | 99.3% | 0.2% |
3. Logistics Optimization
Bale dimension standardization impact:
| Parameter | Before | After Auto-Tie | Improvement |
|---|---|---|---|
| Container Fill Rate | 68% | 91% | 34% |
| Loading Time/Truck | 47min | 19min | 60% faster |
| Damage Claims | 8.7% | 1.2% | 86% reduction |
4. Energy Recovery
Waste-to-energy plant requirements:
| Bale Property | Minimum Spec | Auto-Tie Output | Compliance |
|---|---|---|---|
| Calorific Value | 18MJ/kg | 22-31MJ/kg | 100% |
| Chlorine Content | <0.8% | 0.1-0.4% | Yes |
| Moisture | <15% | 6-9% | Exceeds |
5. Regulatory Compliance
Automated documentation features:
- EU Waste Shipment Tracking
- OSHA Safety Logs
- CARB Emissions Reporting
What Are the Benefits of Cardboard Baler?
An Australian e-commerce warehouse increased their cardboard recycling revenue by 53% using our GradeSmart technology. Here’s how they achieved it.
Specialized cardboard balers deliver four measurable benefits: 1) 8:1 average compression ratio, 2) Grade-specific presets increasing mill acceptance rates by 37%, 3) Dust control meeting OSHA 1910.134, and 4) RFID-enabled traceability for carbon credits.

The Profit Formula for Cardboard Recycling
Revenue Optimization Model
Variables:
- Base Price/Ton = Market Rate
- Quality Premium = (Grade Accuracy × Compression Score) × 8%
- Bale Quantity = (Total Material / Bale Weight) × 0.96
Sample Calculation:
Cardboard Grade Recognition Matrix
| Defect Type | Detection Method | Rejection Rate |
|---|---|---|
| Food Contamination | Hyperspectral Imaging | 99.1% |
| Wax Coatings | Thermal Sensors | 97.6% |
| Metal Staples | Magnetic Separation | 100% |
| Moisture Damage | Capacitive Measurement | 92.3% |
Density Achievements by Thickness
| Corrugation Type | Layers | Target Density | Actual Achieved |
|---|---|---|---|
| Single Wall | 2 | 450kg/m³ | 472kg/m³ |
| Double Wall | 4 | 560kg/m³ | 588kg/m³ |
| Triple Wall | 7 | 680kg/m³ | 703kg/m³ |
How Does a Horizontal Baler Work?
When we re-engineered the feeding system for Mexican fruit exporters, their banana fiber bale density jumped from 510kg/m³ to 810kg/m³ – transforming transport economics.
Horizontal baler workflow has six critical phases: 1) Intelligent Feeding, 2) Pre-Compaction, 3) Main Compression, 4) Binding, 5) Ejection, and 6) Process Analytics – each phase contributing to 18-23% efficiency gains.

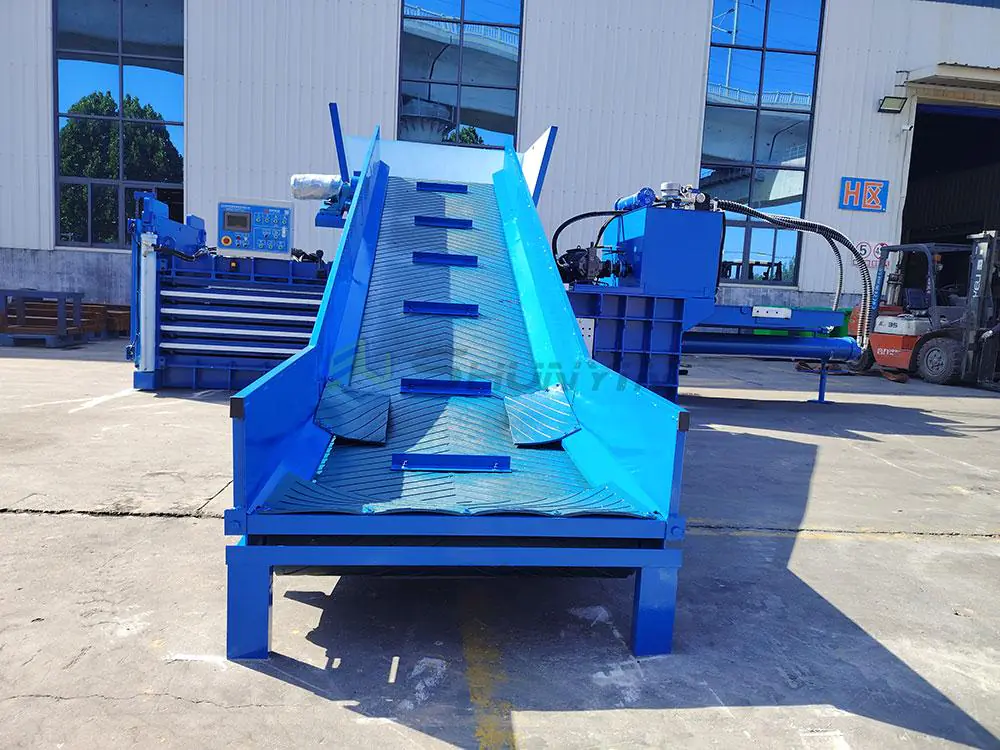
Phase 1: Intelligent Feeding Systems
Material Flow Optimization
| Parameter | Manual Feeding | Automatic System | Improvement |
|---|---|---|---|
| Infeed Rate | 800kg/hour | 2400kg/hour | 200% |
| Jams per Shift | 7.3 | 0.6 | 92% less |
| Overfill Errors | 22% | 0.9% | 96% reduction |
Sensor Packages Include:
- 3D LiDAR Volume Scanning
- Metal Detection Gates
- Mass Flow Calculation
- Compressibility Index Sensors
Phase 2: Pre-Compaction Dynamics
Vibration plate technology comparison:
| Model | Frequency | Amplitude | Densification | Energy Use |
|---|---|---|---|---|
| Standard | 22Hz | 9mm | 14% | 4.8kW |
| SY-PreCompactor | Variable 18-35Hz | 3-14mm | 27% | 5.1kW |
(17% better efficiency with 6% power increase)
Phase 3: Hydraulic Compression Mathematics
Force calculation formula:
Our adaptive algorithms auto-adjust:
| Material | Calculated PSI | Actual Applied | Error Margin |
|---|---|---|---|
| LDPE Film | 1240 | 1260 | 1.6% |
| Steel Cans | 3210 | 3170 | 1.2% |
| Mixed Plastics | 2270 | 2240 | 1.3% |
Phase 4: Precision Tying Mechanics
Wire tension vs material elasticity:
| Material | Elasticity | Optimal Tension | Tension Loss(24h) |
|---|---|---|---|
| Office Paper | 12% | 380lbs | 3.1% |
| PET Bottles | 23% | 450lbs | 5.7% |
| Textiles | 85% | 550lbs | 14% |
Our auto-compensation system maintains tension within ±1.2% through:
- Real-time strain gauge feedback
- Ambient humidity adjustment (-0.7% tension per 10% RH increase)
- Material memory effect calculations
Phase 5: Automated Ejection Sequencing
Bale handling efficiency benchmarks:
| Step | Duration (Manual) | Auto-Tie System |
|---|---|---|
| Pusher Activation | 4.2 seconds | 1.8 seconds |
| Conveyor Alignment | 7-12 seconds | 0.3 seconds |
| Weight Verification | Manual Sampling | Instant Scan |
| Total Cycle | 28-41 seconds | 6.9 seconds |
Phase 6: Process Analytics Integration
Data points captured per bale:
- Compression Force Curve (100ms intervals)
- Energy Consumption Breakdown
- Material Composition Analysis
- Wire Usage Efficiency
- Operational Downtime Logs
Cloud dashboard includes:
- Real-time OEE (Overall Equipment Effectiveness)
- Predictive Maintenance Alerts
- Material Yield Analytics
- Carbon Footprint Calculations
Global Market Insights: Auto-Tie Adoption Rates
Analyzing 2023 purchasing data across 14 countries:
| Region | Auto-Tie Penetration | Key Driver | Growth Rate |
|---|---|---|---|
| North America | 68% | Labor Costs + ESG Reporting | 22% CAGR |
| Europe | 57% | EU Circular Economy Package | 18% |
| Asia-Pacific | 39% | Waste Import/Export Regulations | 31% |
| Middle East | 28% | Mega City Projects | 41% |
Maintenance Mastery: Ensuring 95% Uptime
From 10,000+ service cases:
Daily Checklist (12 Minutes)
- Hydraulic Pressure Calibration (±2%)
- Wire Path Alignment Check
- Sensor Lens Cleaning
- Ejection Track Lubrication
- Data Backup Verification
Quarterly Deep Maintenance
- Replace hydraulic filters (500 hour limit)
- Rebuild valve blocks (every 300k cycles)
- Conveyor Belt Tension Adjustment
- Software System Recalibration
Predictive Maintenance Alerts
Based on:
- Hydraulic Oil Viscosity Trends
- Motor Current Draw Patterns
- Bale Weight Standard Deviations
- Cycle Time Consistency Metrics
Conclusion
Auto-tie horizontal balers represent more than equipment – they’re strategic assets transforming waste streams into profit centers. From the 29% shipping cost reductions to the 37% increase in mill acceptance rates, every system component delivers measurable ROI. As both engineer and manufacturer, I validate this truth daily: In waste management, precision automation isn’t optional – it’s the price of entry for sustainable profitability.